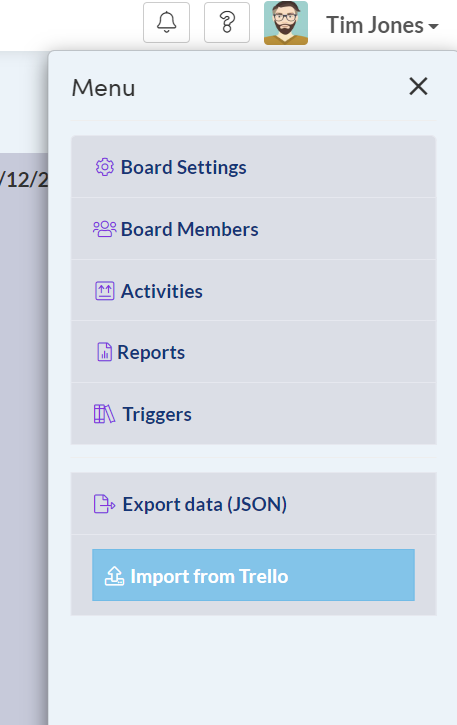
To get reports about tasks you done this week, month or year run reports for that board on the top-right menu.
NOTE: For tasks to be shown on reports tasks must be marked as done. A lot of reports are based on Time Estimate and Time Worked field on tasks.
Reports windows will open where you can define report parameters and filters such as time period or tags.
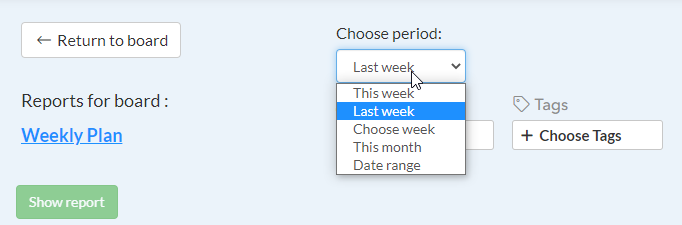
All reports can be additionally filtered by Tags or AssignedTo.
After you, set up parameters click the report you want to run on the right side and click “Show report” button:
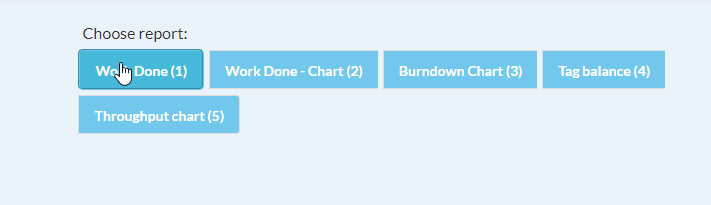
1) Work done
Source for work done report can be tasks or time log.
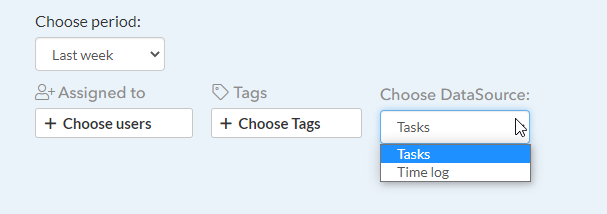
By default, Tasks are selected as DataSource which means that we will use DoneOn Date as the day on which task is done.
Optionally if you choose Time log we will use dates in time log to display this report.
When you click “Show report” report will display with columns as week days.
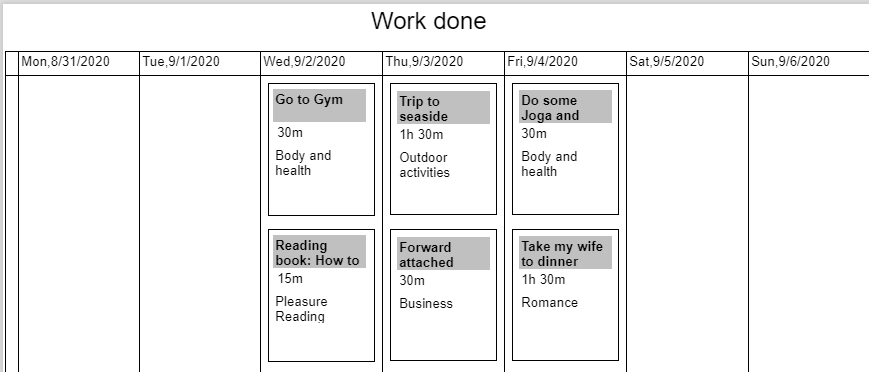
You will see all tasks you finish each day of the week, including task name, time worked on that task, tags, and assigned to members.
You can always filter report to display only one tag or one member you assigned on tasks.
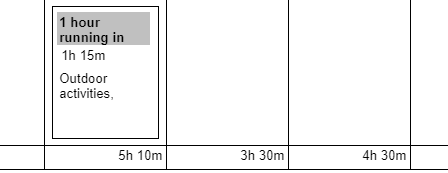
In the bottom of the report you can see sums time worked on each days.
2) Work Done – Chart
To get this report to display you must populate time worked column on tasks.
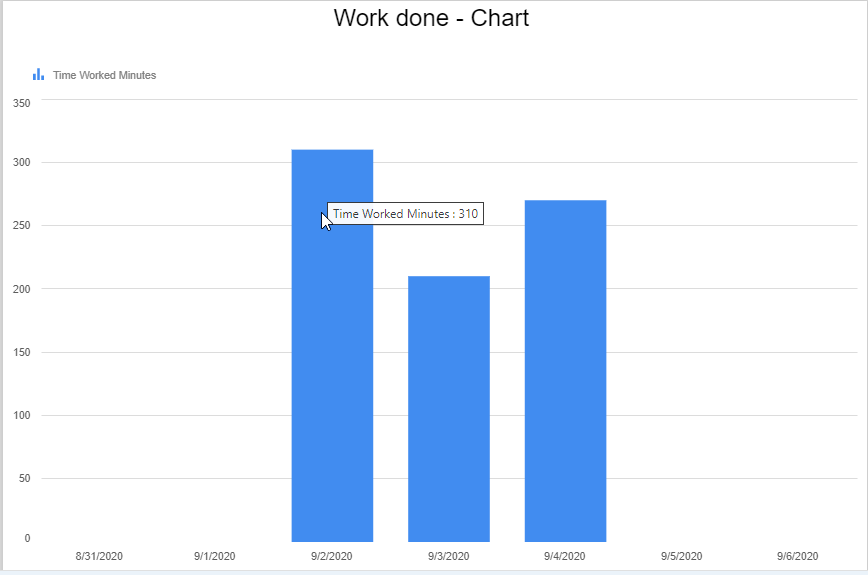
You will get visual representation how much you worked each day.
You can additionally filter this report by tags or assigned to members.
3) Burndown Chart
This report shows difference between time estimate and time worked field on tasks so you need to populate both fields on each task to get this report.
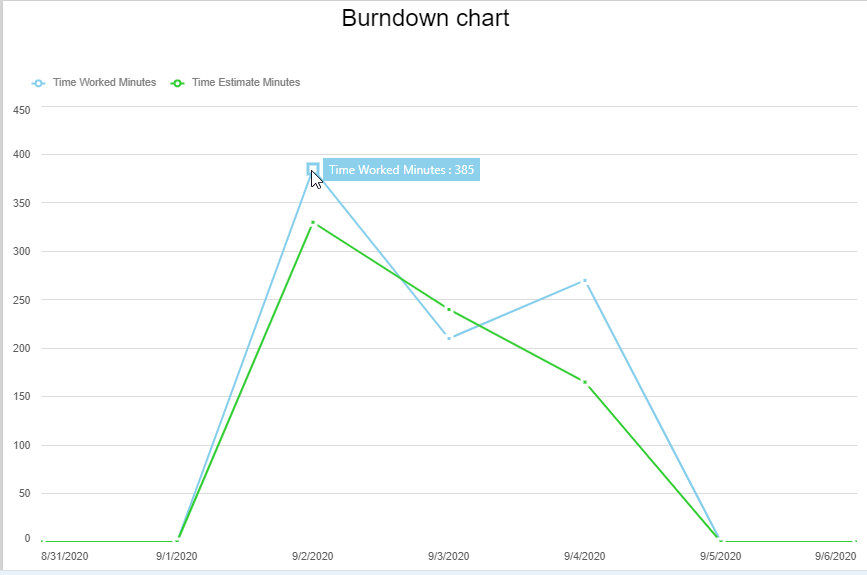
You will get visual representation how fast you burn tasks each day.
You can additionally filter this report by tags or assigned to members.
4) Tag balance
To get this report you need to assign tasks in certain categories using tags. Optionally you can populate time worked field to get how much hours you worked on each category.
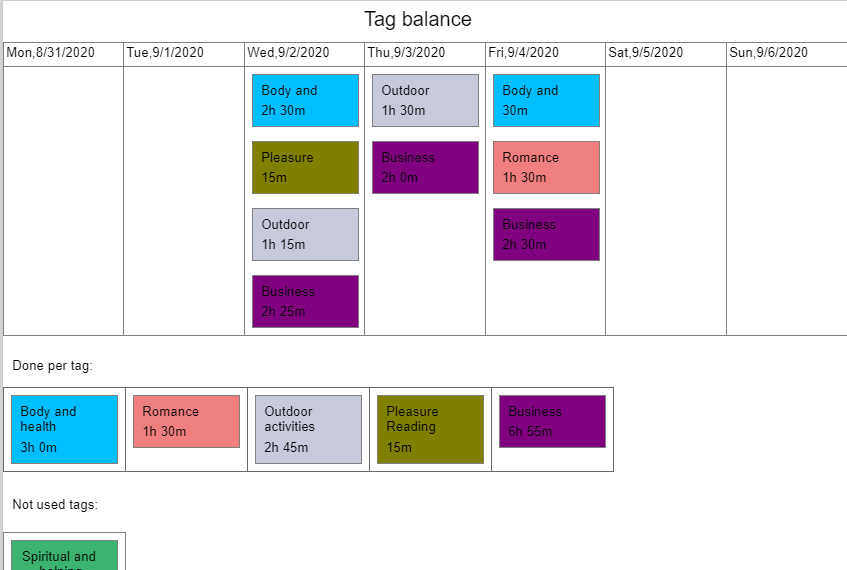
This way you will get visual representation how much you worked each day and for entire week for particular tag.
If some tag is not used is will also be displayed in “Not used tags” section.
Use this report to see how good is your work – life balance each week.
5) Throughput
For this report you must populate time worked field on tasks.
This reports shows how much time you spent on each column / day.
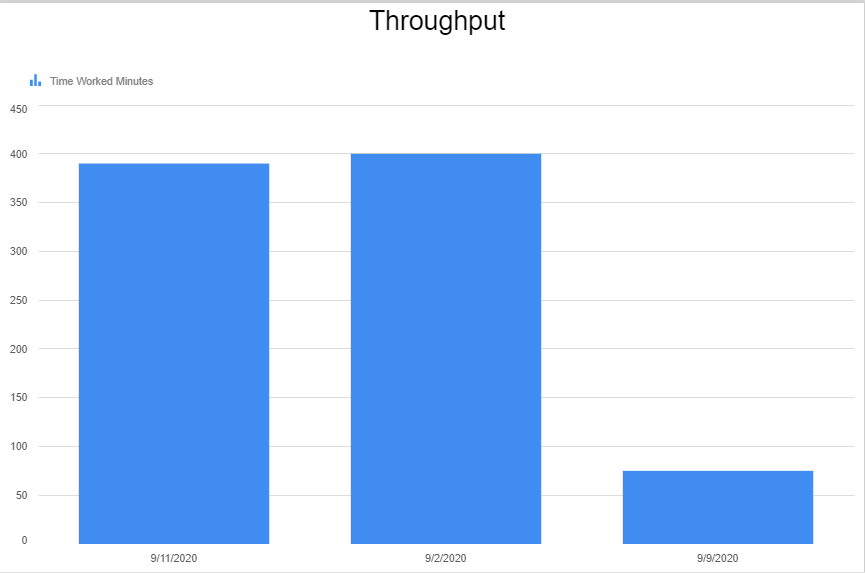
You can additionally filter this report by tags or assigned to members.
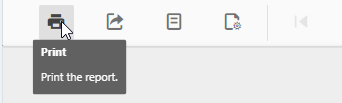
Pring, Page setup, Export reports
To print report, page setup or export reports use menu bar icons in top left corner of each report.
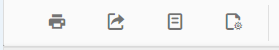
To page setup report use first paper like icon on right side.
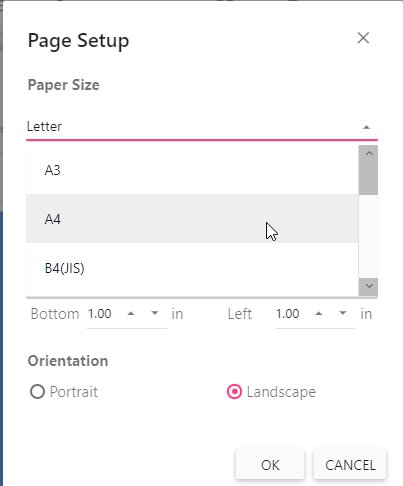
Choose different Paper Size such as Letter, A4 etc or change report orientation.
To export the report, click the second icon from the left side. You can export each report in PDF, Excel, etc.
To print report click print icon.